Genetic Ancestry Portraits
“Crossing Beringia”
“Crossing Beringia” is a portrait of a Native American man (Ron) from the Ojibwe tribe in Minnesota. Follow the paths of his maternal (yellow) and paternal (blue) ancestors as they leave Africa, heading north to Siberia and across the (now) submerged continent Beringia to the Americas—a journey of thousands of miles made over ten thousand-plus years.
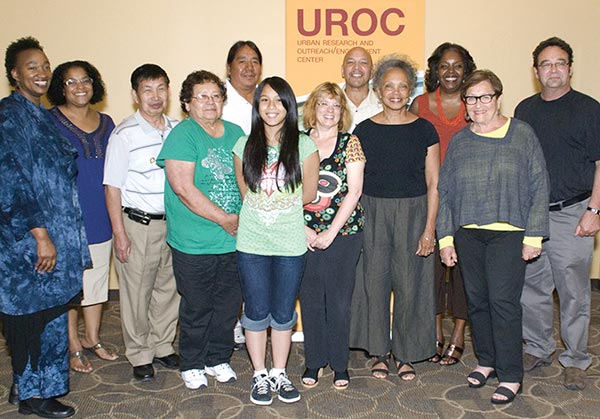
The University of Minnesota commissioned this portrait and four others (three shown below) for an exhibit at their Urban Research and Outreach-Engagement Center (UROC).
I built the exhibit on a body of work produced over five years—DNA portraits of more than 24 people showing their genetic data (migration paths) on a map with a written interpretation of the science. If you’re curious about my process and artistic vision for the exhibit, scroll for the article “Making the DNA Portraits.”
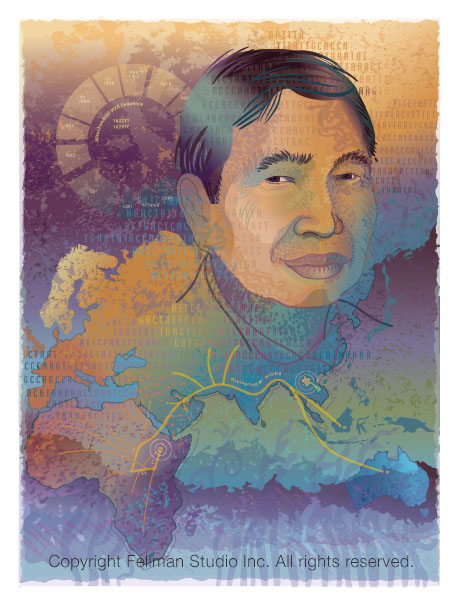
“First Wave”
Khao is an American originally from Laos. His portrait, “First Wave,” shows his maternal migration path, haplogroup M. They may have been the first modern humans to depart from Africa successfully. Members of his group headed east across the narrow span of water that separates East Africa from the Arabian Peninsula.
It started a long migration eastward, across the Middle East to Southern Eurasia — close to Khao’s birth home in Laos. You can see that the lineage branches with some of his ancestors continuing to settle in Australia and Polynesia.
“Spiral Journey”
“Spiral Journey” is a portrait of Judy, an African American woman. It traces the paths of the L3 group, a lineage that arose in Africa about 80,000 years ago. They were a group of modern humans leading the out-of-Africa migrations.
Judy’s ancestors were members of a group that decided to remain in Africa — traveling west and north, spiraling around the continent’s top half. Descendants in Western Africa formed the lineage found today in many African Americans — often due to the transatlantic slave trade. Judy’s “L3e” haplogroup is also common among Afro-Brazilians and Caribbeans.
“Deep Waters”
Wayne, an African American man, chose to have his DNA sequenced from his Y chromosome. His paternal Haplogroup, E1B1a (M2), is shared with most sub-Saharan Africans and many African American men.
The first genetic marker in Wayne’s lineage is “M168”. The marker locates the beginning of the migration route close to present-day Ethiopia, Kenya, or Tanzania in the Rift Valley region. Scientists estimate the emergence of this marker to be approximately 31,000 to 79,000 years ago.

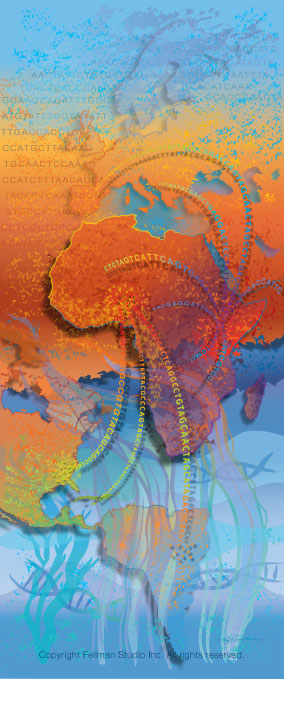
Genetic Ancestry and Family History Portrait
Not all of my DNA portraits include their genomic data and a drawing of their face. This portrait of Dr. Charmaine Royal is a big-picture view of the migrations from deep time out of Africa combined with Dr. Royal’s knowledge of her family history.
I worked closely with Charmaine to capture her story. As director of the Center on Genomics, Race, Identity, and Difference at Duke University and a Professor of African and African American Studies, Biology, Global Health, and Family Medicine, the image is close to her heart and research. The image was printed on canvas with the top wrapped on a wooden dowel and displayed like a tapestry in her office at Duke.
Making the DNA Portraits.
It was the pairing of science and art in the National Geographic magazine on the table in my childhood home that sparked my lifelong interest in paleoanthropology.
Fossils from the Great Rift Valley hinted at our ancient origins. The marvelous paintings depicted our ancestors from the fossil bits. Dark and mysterious, a shadowy fire-lit cave, a family huddled around, talking, most certainly singing — I was mesmerized.
That was the 1970s, and fossil discoveries of early hominids captured my imagination. Yet, there were gaps in the stories the magazine so artfully told. Where did we come from? How did we evolve? What makes us human? The answers, like the fossil bits, were fragmented.
The magazine’s paintings were beautiful but speculative interpretations. Thanks to present-day forensic genomics, artists now create scientifically accurate visualizations of our ancient ancestors. Take a look at one who has mastered the art of depicting archaic hominids — paleo artist John Gurche.
The Genomic Era. Then, on June 26, 2000, a scientific and technological milestone kicked off the 21st Century. Popular media caught the history-making excitement in a 72-point bold-face headline, “Scientists sequence the human genome!”
Bioinformatics scientists and geneticists had worked furiously for over a decade to master the difficult technology. Once successfully reading the ATCG code, they began assembling the data into a reference genome — a library of human genetic variation.
Sequencing the human genome is one of the most significant scientific accomplishments. Bold and audacious and enormously expensive; when the Reference Genome was completed in 2003, it launched genomics as the premier science of the Twenty-first Century.
The work continues because the Reference doesn’t include the entire, end-to-end sequence of all 24 chromosomes: 22 autosomes + X and Y. Efforts to build the human Pangenome are underway by dedicated scientists like Dr. Karen Miga.
Listen to her 20-min video talk about the genomics era and her research to assemble the first, complete sequence of the human X chromosome. Check out Dr. Miga’s paper in Nature about the research.
Old DNA + new DNA = genome stories. While bioinformatics scientists were building the reference, other researchers found new applications for sequencing tech. Anthropologists got busy scrutinizing the genomes from living people. Others were extracting ancient DNA from fossil bones.
Comparing sequencing data from modern and archaic DNA began to bring the fragmented pieces of human history together. Genome stories we thought we’d never know through the mighty combo of genomics and anthropology.
Scientists also look for variants in ancient DNA that could impact present-day human health. For example, the Neanderthal genome had mutations they passed to early humans, allowing our ancestors to adapt to new environments. People alive today with the same variants enjoy the genetic gift from our extinct cousins.
For more about our extinct cousins, Neanderthals and Denisovans, learn from evolutionary geneticist Svante Paabo. He developed best-practice methods to extract and analyze ancient DNA and understand our evolutionary history.
What about my DNA? Information from the Reference Genome was adding knowledge of present-day human biology. Ancient DNA was expanding the story of human evolution. Together they were writing new chapters in the history of our species.
Exciting stuff, but some of us asked, “will scientists sequence everyone’s DNA?” I wondered, “could I get my DNA sequenced?” An opportunity appeared in 2005 from the Genographic Project.
Hello, direct-to-consumer genetic ancestry testing. The Genographic Project was an innovative collaboration between science and commerce. Geneticist-anthropologist, Dr. Spencer Wells, led the scientific team collecting DNA samples from indigenous people around the world.
The commercial partner, IBM, offered sequencing to the rest of us — the Y chromosome (paternal) and mitochondria (maternal) — to determine genetic lineages. Not only would we get insights into our “deep” ancestry, but we could opt-in to scientific research as well.
The Genographic Project was one of the first direct-to-consumer DNA companies. Unlike its competitors, it was a global, interdisciplinary project with two components; field research and public participation.
1) Scientists collected DNA from Indigenous people around the world, revealing never-before-seen patterns of human migration. The patterns were formed by mutations—genetic variants scientists identified as ancestry information markers (AIMs). As people traveled great distances over many generations, the markers became visible as paths on the world map. Check out my video about genetic ancestry.
2) Participation from over 500,000 people also changed the genomic research landscape. Access to a large cohort of genomic data contributed to new scientific knowledge. After all, we all hold genomic information essential for biomedical science to advance. Launched in 2005, the public involvement in the project ended in 2019.
Yahoo, I’m in! Who wouldn’t want to be part of scientific discovery? It was the summer of 2005, and I bought a kit swabbed away, and eight weeks later, my results came back. My mitochondrial DNA placed me in Haplogroup H — typical for my Swedish-German-Northern European background.
No surprise, but I was elated. My results included a graphical display of my Haplogroup as a path on the world map. It traced my lineage back through time and across continents to the common female ancestor in Africa. It was a striking visualization with an aesthetic of haunting beauty.
What’s a Haplogroup? It’s the path formed by genetic variants identified as having important ancestry information. The variants are changes (mutations) in our DNA that accumulate over generations. They “mark” our genetic history like a “molecular clock,” forming branching paths worldwide. We share our haplogroup path with thousands of people. My haplogroup H is part of an extensive, Northern-Western European lineage with many branches.
Artistic inspiration. It’s a story everyone should know; to understand how we’re all connected; get the sense of wonder I was feeling. How could I communicate the experience?
I dove into drawing and writing about what I was learning, working out my artistic interpretation of our connections through deep time and across continents. The outcome from hundreds of sketches and hours of study evolved into a new body of work — genetic ancestry DNA portraits (some shown above).
First, my friends agreed to a portrait. Later, others knocked on my door as art-buying patrons — all early and brave genome explorers — excited to get their DNA tested and have their portraits made.
Are mutations harmful? Do the migration paths show my recent ancestry? Is everyone really from Africa? (Yes!) These were some questions my friends asked. My answers were garbled. So it was clear, I needed to get smart and fast. To explain science as a story and to make my art intelligent.
Subscribing to scientific journals and reading the latest books was a start. Meeting people on the frontline of genomics research, even better. I attended scientific conferences in the U.S. and abroad, listening and learning from the best.
Eventually, I was invited to show my work at scientific conferences. If you attend Cold Spring Harbor Lab meetings, look for me at the next in-person Biology of Genomes. As an artist-in-residence, I show my current artwork and explain materials and methods.
Artistic vision. My intrepid participants found their DNA test results intriguing but mystifying. So we discussed the report together, and when their portrait was completed, we reviewed their results again. But this time, reviewing the data embedded in the portrait, the difficult concepts were easier to grasp.
It became clear that the artwork needed a story, a companion that could explain it. So with each new portrait, I included a one-page letter summarizing the scientific research. Eventually, the letter evolved into a storyboard — a graphical display that deciphered the science in the art.
As I began to show the genetic ancestry DNA portraits and storyboards, I listened closely to the comments. It seemed that a person’s face on a map of ancient migration paths based on their DNA made science personal. The storyboards made complicated science understandable.
Could the pairing of art and science in this way elicit a sense of wonder for the natural beauty of science? If so, it was the emotional response I was hoping to get from my fellow Genome Explorers.
Making digital art during the 1990s was discouraging. My images couldn’t live in the real world. No printer could duplicate the vibrant colors; no print media had the archival qualities that traditional media offered. Alas, you could only view my work on a screen.
Then in 2005, a new printer offered stunning, museum-quality output with true-color fidelity. It required specially formatted pigment inks and fine art papers treated to pair with the inks. And a lot of technical expertise to put it all together.
I took a course to get the know-how and then bought one of the pricey, large-format printers. After testing many archival substrates with the pigment inks, I found the right mix. What I saw on my display printed true and with deep, vibrant color. Now I could print, frame, and show my work anywhere. Yay!
The University of Minnesota commission. A biological anthropologist at the University of Minnesota, Dr. Irma McClaurin, saw my portraits and thought they could inspire a broader audience. As director of the new Urban Research and Outreach Center (UROC), she wanted to celebrate the diversity of people living in the neighborhoods.
Dr. McClaurin encouraged me to write a proposal to create artwork about the UROC mission, “a gathering place… in an educational and cultural setting where the community and University researchers work together to improve the lives of those in urban areas.”
A proposal for the portraits. I proposed a SciArt exhibit — a display of science, art, and story — celebrating how we’re all connected, in our communities and worldwide, via deep lineages back to our original home in Africa.
The proposal included portraits and companion storyboards showing the source of the scientific data, explaining what it means, and a biographical sketch about the participant’s family and profession. The artwork would be unveiled at the opening of the new center.
Dr. McClaurin championed my “Genetic Ancestry DNA Portraits” proposal, and we got it funded! We started by asking civic leaders to select people to represent the community’s diverse demographics; African American, European, Asian, and Native American backgrounds. Invitations were sent to the people shown above; Judy, Wayne, Ron, Khao, and Reva.
Speaking of diversity, the Human Reference Genome isn’t. The DNA used to build the variant library for the Reference Genome came from people with European ancestry. Lack of diversity skews science and limits medical and health benefits. It’s a big problem.
Scientists such as Adam Phillippy at the National Human Genome Research Institute are working to change that. Dr. Phillippy and colleagues are building the “Human Pan Genome” to expand diversity in the reference library.
The portrait process. Judy, Wayne, Ron, Khao, and Reva accepted our invitations and were eager to get started. I met with each one and explained the portrait-making process.
The first step was to order DNA kits from Genographic. When they arrived, I invited the participants to my studio for individual sessions. We opened the kits; I helped them take their sample, fill out the forms, and then I express-mailed the packages to the lab.
It was 2009, and consumer DNA testing kits were persnickety. They had a detailed procedure, and I followed it precisely with each participant. After all, swabbing to get enough cells for a good sample was a new experience for all of us.
I express mailed the samples to make sure they arrived at the lab in Tucson, Arizona fast and all together. Getting the results back could take eight to twelve weeks, and I had no time to lose to finish the exhibit for the Center’s opening.
Art making. While meeting one-to-one, we talked about their work and leadership in the community. I made notes and sketches. They sat in my big red chair while I took photos for their storyboard and to use as a reference for their likeness.
Now I could get going on the artwork. It was a lot to tackle; first, sorting through photos for the best three-quarters version of their face. I started drawing with a pencil and tracing paper to get the right expression and capture their likeness.
A face on a map is too clinical, so I made textured marks, chromosome shapes, and double helix patterns with paint and brush on paper. After scanning the sketches and brush paintings, I used my digital tools to work on the composition.
The opening celebration. Full-size portraits (4 x 5 feet) were printed, framed, and paired with companion storyboards for UROC’s 2010 celebration. Before the doors opened, I gave Judy, Wayne, Ron, Khao, and Reva small versions of their portrait and storyboard.
Everyone invited friends and family. Ron asked his students to attend. Standing in front of his portrait, “Crossing Beringia,” Ron explained some of the science while weaving it into the Ojibwa creation story. We were captivated!
As more guests arrived, they recognized the people in the portraits. “Tell me your story; what was it like to get your DNA tested?” they asked. Judy, Wayne, Ron, Khao, and Reva were celebrities!
Art and story for the wonder of science. I stayed in the background to watch and listen. Some guests quietly read the storyboards, then studied the art and turned back to the story. Spontaneous and animated conversations popped up around each portrait. It seemed that my SciArt approach could make genomics personal, relevant, and sometimes evoke a feeling of wonder for the beauty of science.
The portraits are historical documents. Decades into the Genomic Revolution, the deluge of data tells us much more about our individual DNA. If I added what we know today, the haplogroup paths would be a mess of branches, stretching across every continent.
Our species’ meta-story. Even though the data in the portraits is out-of-date, the core message hasn’t changed. Africa is our species’ original home. Your genetic ancestry is one thread in humankind’s meta-tapestry — making us all connected over space and time. It’s an evolutionary history we thought lost forever.
Well received by scholars and people in the community, the exhibit remains at UROC. I’ve moved on from making Genetic Ancestry DNA Portraits to new ways to show the beauty and value of science.

Shown above are the people involved in the Genetic Ancestry DNA Portrait exhibit. We gathered in June 2010 for this group photo. Dr. McClaurin and I (Lynn Fellman) and my portrait participants; Judy, Wayne, Ron, Khao, and Reva. Some of their family members and gallery assistants are also in the photo.


